
What is the Timeline (Motion Graph, Sound Graph, Bubbles, Timelapses)
Timeline
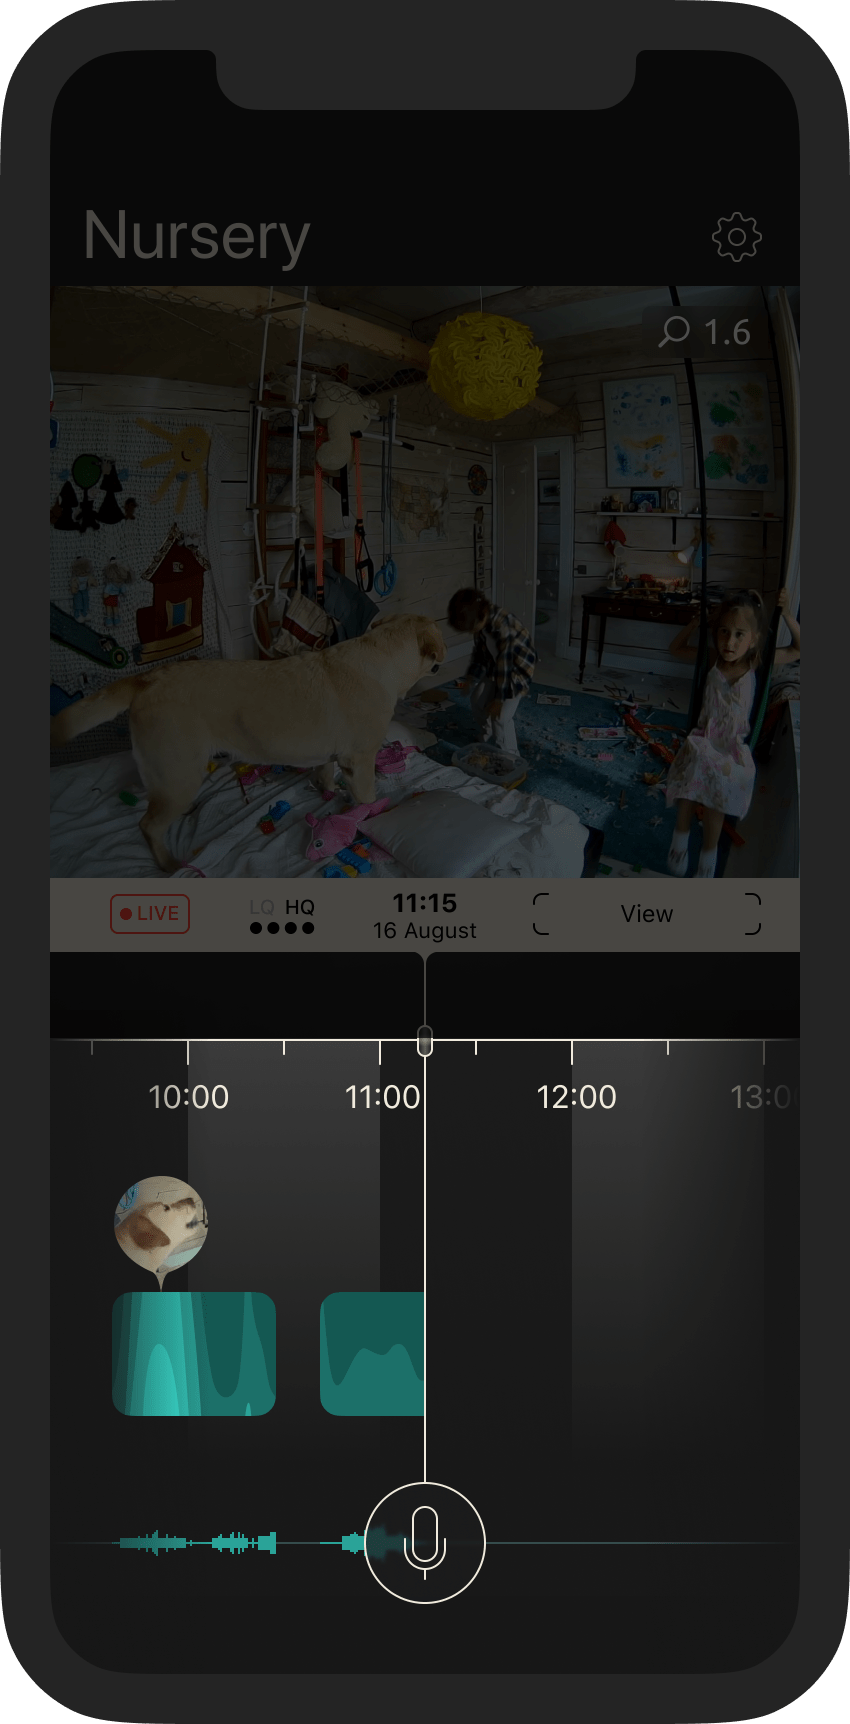
Navigate through your footage by scrolling the Timeline left and right. Pinch an area using a multi-touch finger gesture to zoom in or out and define the time unit granularity (to more closely observe hours, minutes or seconds).
Motion Graph

Motion Graph on the Timeline represents the fixed-height time-intensity chart, where brighter-colored areas show more active motion during a concrete chronological period.
Bubbles

Bubbles are circular visual frames that enclose captured faces and objects recognized by Homam’s built-in intelligent engine. Each Bubble is tied to the concrete timestamp at which it was captured.
Faces and objects are highlighted on the Timeline in visual frames called Bubbles.
The embedded face and object detector registers moving objects only. Objects that exceed the thresholds of default size and velocity values trigger an event. Homam calculates the designated score value for any captured event. This score is used to decide which event should be present on the Timeline. Homam’s proprietary algorithm captures the best possible image of the top-scored events, which isn’t always at the activity peak. Tap on a Bubble to instantly go to the specific moment in the recorded archive.
Sound Graph
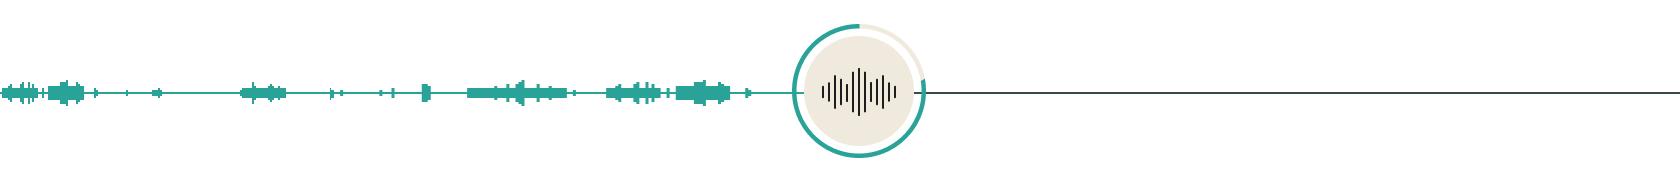
Sound Graph on the Timeline is represented by an oscillogram (time–sound amplitude chart). While the live stream is on screen, Sound Graph occupies only the left side of the picture and is linked to the centered Two-Way Audio interactive button (whose purpose is to record and send voice messages to Homam for playback).


